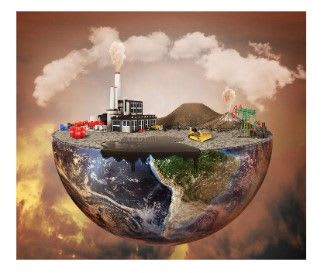
Earth is such a vast domain, spanning miles and miles far beyond what we can see and reach. When we look at the real world, it is too big and complex to analyze with our eyes. We cannot see all the buildings in a city or the start and end of a river at just one glance. To understand various phenomena, we need to scale down the earth and represent it in a way that is easy to understand. We need to visualize it in a geographical space that is closer and more tangible to us.
As we scale it down, we represent the earth using standard methods to ensure we don’t lose the spatial and characteristic aspect of features. Therefore, we employ data models to represent reality digitally. This way, we can see an entire city at the glance of a screen. In the digital space, the possibilities are endless. We can perform geospatial analysis such as determining areas and detecting changes. Moreover, we can store the data in a Geographic Information System (GIS) that manages spatially referenced digital data in as precise context, useful in various sectors including transportation, health services, and land management systems.
We use two primary data models to represent the real world in a digital space: the Vector and Raster Models.
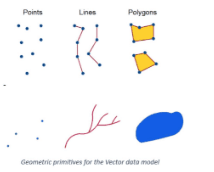
The vector model is characterized by points, lines and polygons to represent real-world phenomena.
The raster model is characterized by regular grid cells, where pixel values represent real-world phenomena.
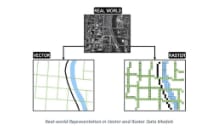
Real-world Phenomenon on Vector and Raster Data Model
Vector Data Model
The Vector Data Model represents the earth’s features in 3 geometrical primitives: points, lines and polygons. Geometrical primitives for the Vector data model
- Points are zero-dimensional. They have a single pair of coordinates, representing singular discrete features like trees.
- Lines are one dimensional, consisting of multiple connected points. They represent linear features such as roads and rivers.
- Polygons are two-dimensional, consisting of multiple lines that loop back together to form an enclosed feature. They represent features with areas and perimeters like lakes and cities.
The Vector Data Model utilizes the Cartesian Coordinate System (x, y) to store shapes. From Mathematics, we consider that a vector is a geometrical structure with a specific shape, length and direction. Therefore, these primitive features are not just shapes. They are precise and accurately represent the real world. If a river is 30 m long, we can represent it with a line utilizing a scale of 1cm rep 1000 m aligning its direction in the real world.
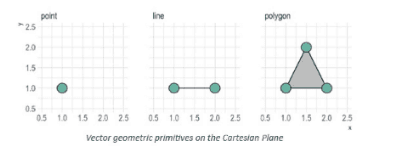
Vector geometric primitives on the Cartesian Plane
The level of representation depends on the details needed, which defines the scale. For example, buildings in a large area can be represented on a small scale by points if they are not the focus of the study. In other cases, the buildings can be represented as polygons at a larger scale if we need to see the extent of each building.
The Vector Model is mainly used in GIS for information storage in a database management system. Each feature has a unique identification number and attributes (more information on the feature). We can easily click on a feature and regularly update it and its attributes when changes occur, such as the ownership status of the construction of more buildings. Vector data is mostly stored in the Shapefile format.
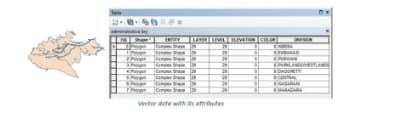
Vector data on attribute table
Raster
The Raster Model consists of a grid-based system of tiny equally-sized shapes called pixels, arranged in rows and columns and connected to form an image. The model is visual-oriented, similar to regular digital photos. When you zoom into a digital image, notice the array of tiny squares that make up the image. The small shapes are pixels that combine to form a compact image. Most pixels are squares because they are the simplest to work with. However, we also have triangular pixels, octagons, and other shapes. The pixels form the building blocks to represent features in the geographical space.
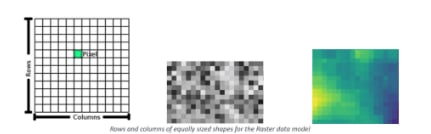
Rows and columns of equally sized shapes for the Raster data model
Each cell has a single value representing a phenomenon. If there is no data in a pixel, it is assigned a value of 0. Every pixel has a value. A major factor when it comes to Raster data is the Spatial Resolution. Spatial Resolution is the number of pixels used to construct an image. An image’s accuracy and spatial resolution are lower when more area is covered per pixel. More, small pixels capture more detail and make an image look sharper than a few, larger ones.
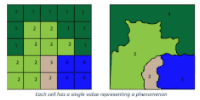
Each pixel represents a portion of the earth. A 10-meter image resolution means that each pixel represents 10m by 10m on the ground (100m²), which is a high resolution. We can also have 1km by 1km area on the ground per pixel, which is a low resolution that will lead to loss of some information.
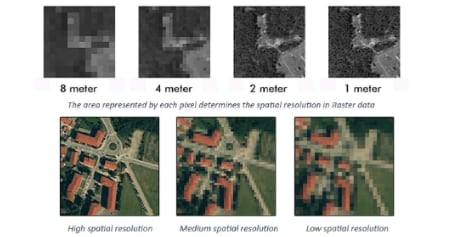
Raster data comes at the cost of more storage space and processing time. Low-resolution images require less storage and can be quickly processed while high-resolution images require robust software and hardware capabilities. Just like normal digital images, very sharp and clear images will generally take longer to download and occupy more space than low-quality ones. For Geospatial Analysis, a good image would be somewhere in between: pixels small enough to capture finer details and large enough for reasonable processing time and space requirements. The purpose of a study and the kind of analysis needed will determine the most suitable resolution. To get a general idea of an area, a low-resolution image would suffice while delineating the width of a river would require a high-resolution image.
Raster data is captured using an aerial camera or satellites. The image has to be georeferenced into its exact location in a virtual geographical space using various geospatial software like ArcGis. Beyond GIS, the Raster Data Model is commonly used for earth observation such as monitoring ocean tides and forest degradation. The data is mostly stored in the Tiff or jpeg format.
Comparing Vector and Raster Data Model
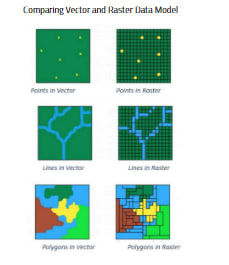
Vector and Raster Data Models are essential for analyzing and understanding our environment. They allow us to convert the complex world into a simpler form. We can examine the earth and see the relationships between various features, both natural and man-made.
We can also know the extent of forests and oceans, and monitor the growth and sprawling of cities. This analysis is done in geospatial software such as ERDAS Imagine and AutoCAD which provide a geographic space with coordinates, similar to the real world.
- Representation of the earth: Vector data tends to be a simpler representation of the real world because of the precision and accuracy of the discrete primitive shapes (points, lines, polygons). From an aesthetic impact approach, the vector data model is more aesthetically pleasing and easier to understand than Raster data. The use of simple shapes makes it look clean, almost hand-drawn.
- Storage: Vector data requires less space and computational power that Raster data. This challenge from the Raster Data Model has been countered by the advent of Google Earth Engine, a cloud-based platform that retrieves images from various sources and processes them online.
- Complexity: Raster data tends to be less complex than vector, especially when storing information. With Vector data, each aspect of the shape must be explicitly stored, including any vertex. Raster data is stored wholesomely when it comes with metadata from the data source.
We can convert Raster data (an image) into Vector data through digitizing (tracing). This involves loading the raster data into geospatial software and ‘drawing’ out the features into either points, lines, or polygons.
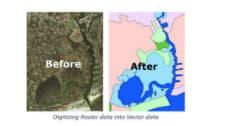
Digitizing Raster data into Vector data