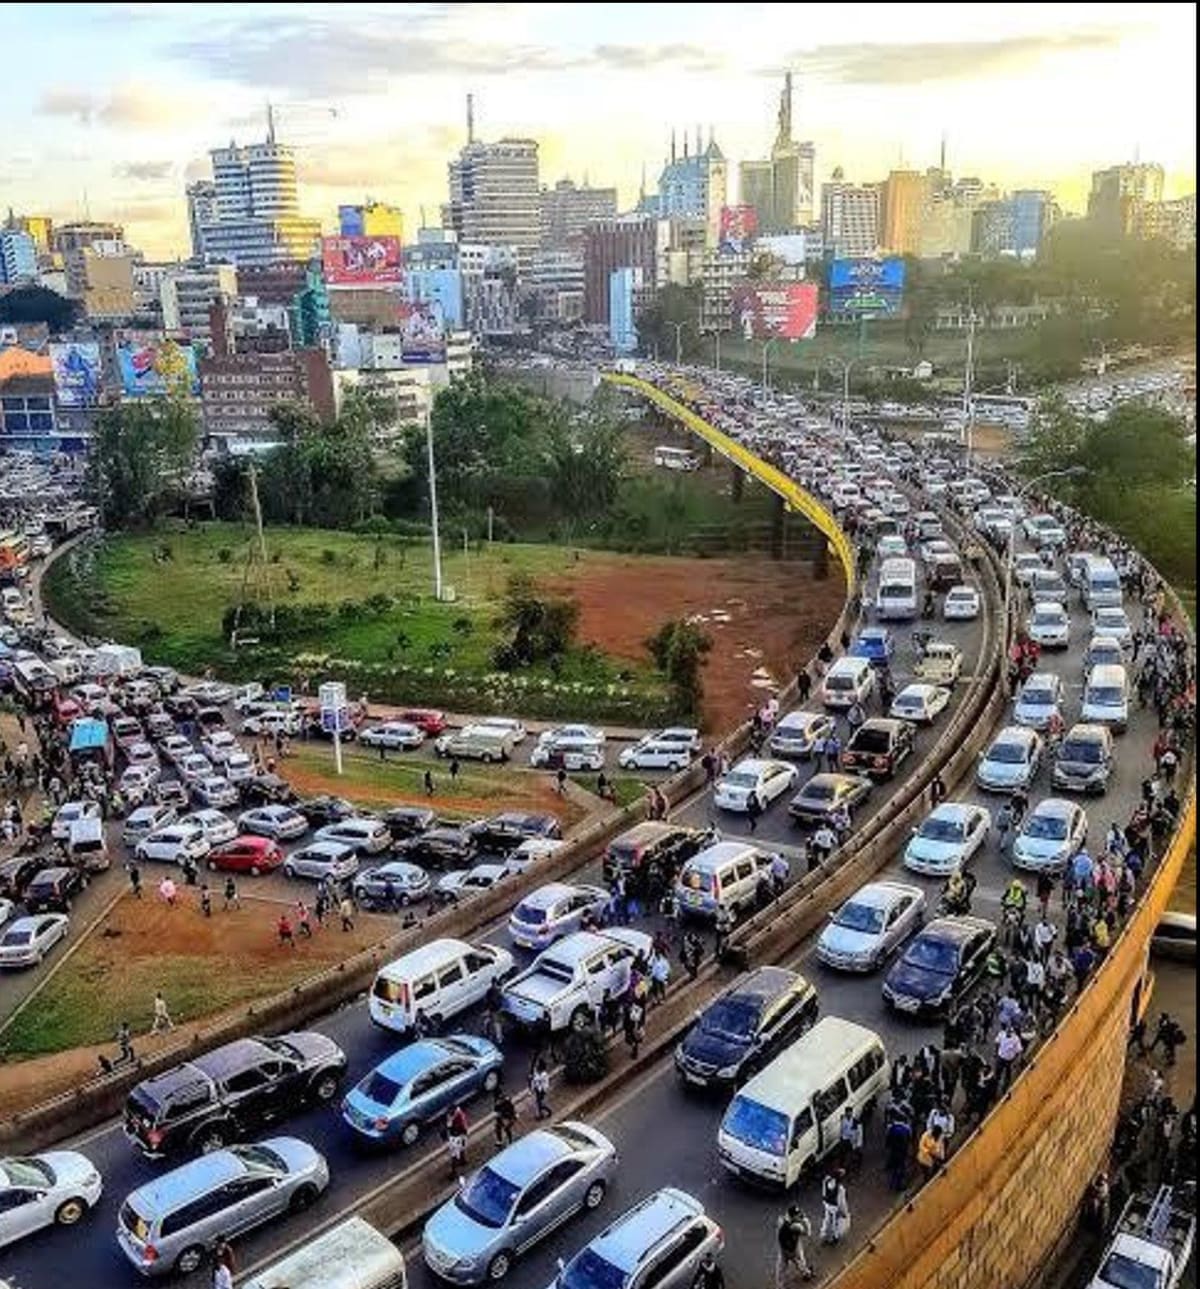
Ask any Nairobi commuter what “smart city” means to them and you probably won’t hear the words “digital twin” or “IoT sensor”. You’ll hear about the forty minutes lost on Thika Road every morning, the matatu that suddenly changes route without warning, or the bus stop that floods every time it rains. For most people, urban infrastructure is judged by one simple question. How long does it take to get where I’m going? Increasingly, the answer is being shaped not by new roads, but by better maps.
A City That Grew Faster Than Its Plans
Nairobi’s road network was never designed for the number of people using it today. Many matatu and bus routes evolved informally over decades, shaped by where SACCOs found demand rather than by any citywide transport plan. The result is a system that works, in the sense that it moves millions of people every day, but works inefficiently: overlapping routes on some corridors, underserved gaps on others, and almost no shared data on where the real congestion is building up hour by hour.
This is precisely the kind of problem Geographic Information Systems (GIS) were built to solve: not by adding more roads, but by understanding, precisely and spatially, how the roads that already exist are being used.
From GPS Traces to Better Routes
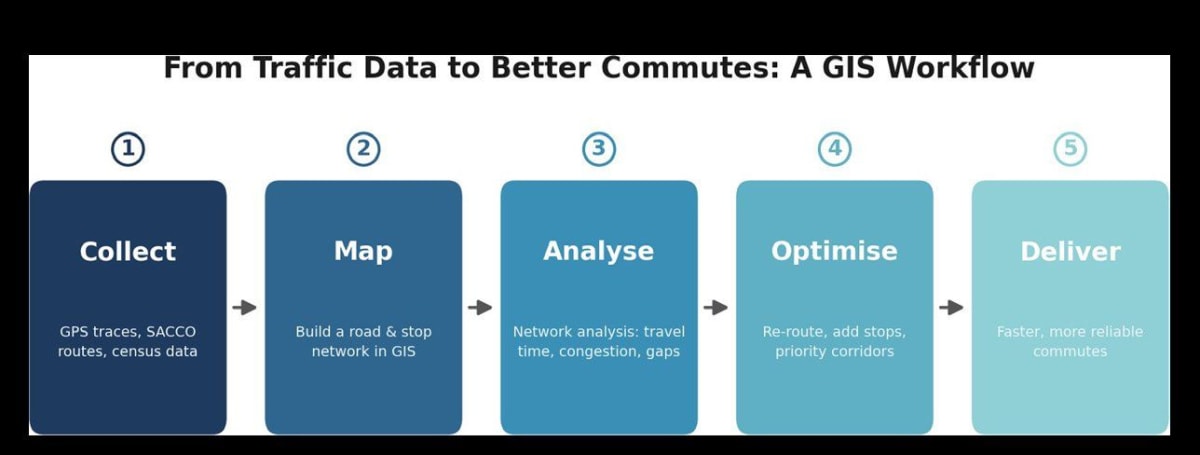
The process starts with data that is often already being generated but rarely used: GPS traces from vehicles, mobile-phone location patterns, and manual traffic counts at key junctions. Once collected, planners build a network model in GIS, essentially a digital version of every road, junction and bus stop, each one tagged with attributes like speed limit, lane count and typical congestion levels.
From there, network analysis tools can answer questions that used to be pure guesswork: which junctions cause the worst bottlenecks, where a new bus stop would save the most collective travel time, or which alternative route would genuinely be faster during peak hours rather than just feel that way. Satellite and drone imagery add another layer, tracking informal settlement growth along transport corridors so planners can see where demand is heading before it shows up as gridlock.
What This Looks Like on the Ground
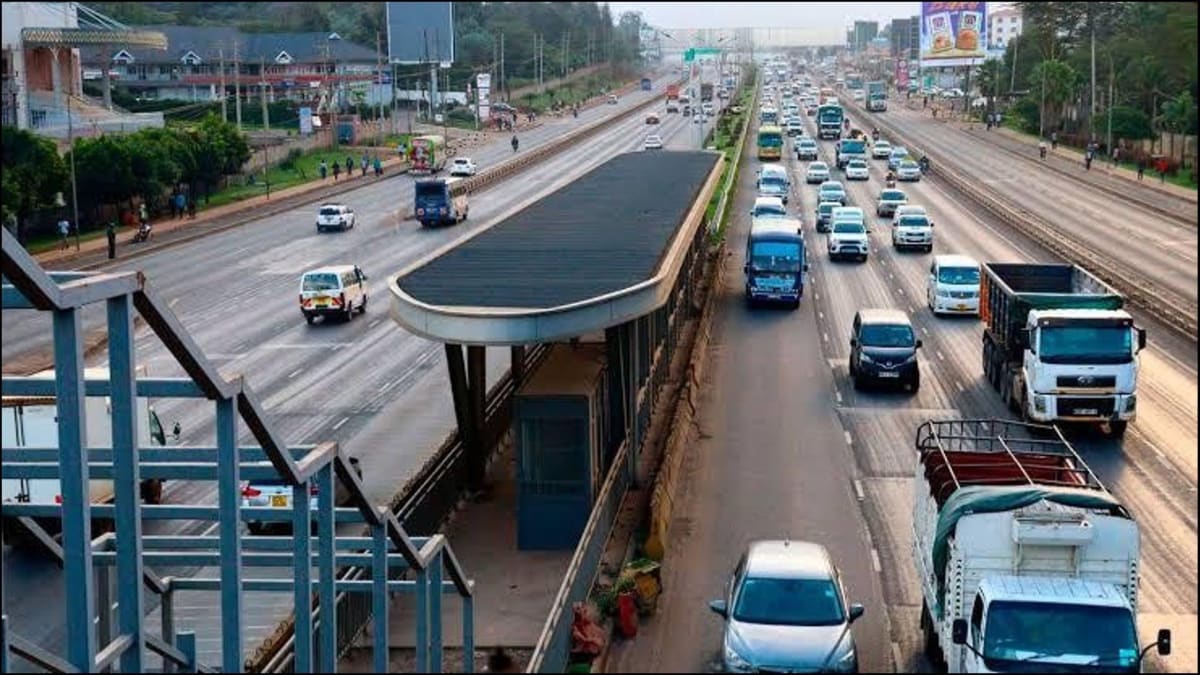
Nairobi’s Bus Rapid Transit (BRT) planning offers a real example of this approach in action. Candidate corridors, including the Thika Road line, were assessed using traffic volume data, population density and land-use patterns to decide where dedicated bus lanes and stops would deliver the greatest benefit for the number of people affected.
It is the same underlying logic used across the industry for siting any piece of infrastructure: layer the relevant data, weigh the criteria that matter, and let the map show where the investment goes furthest.
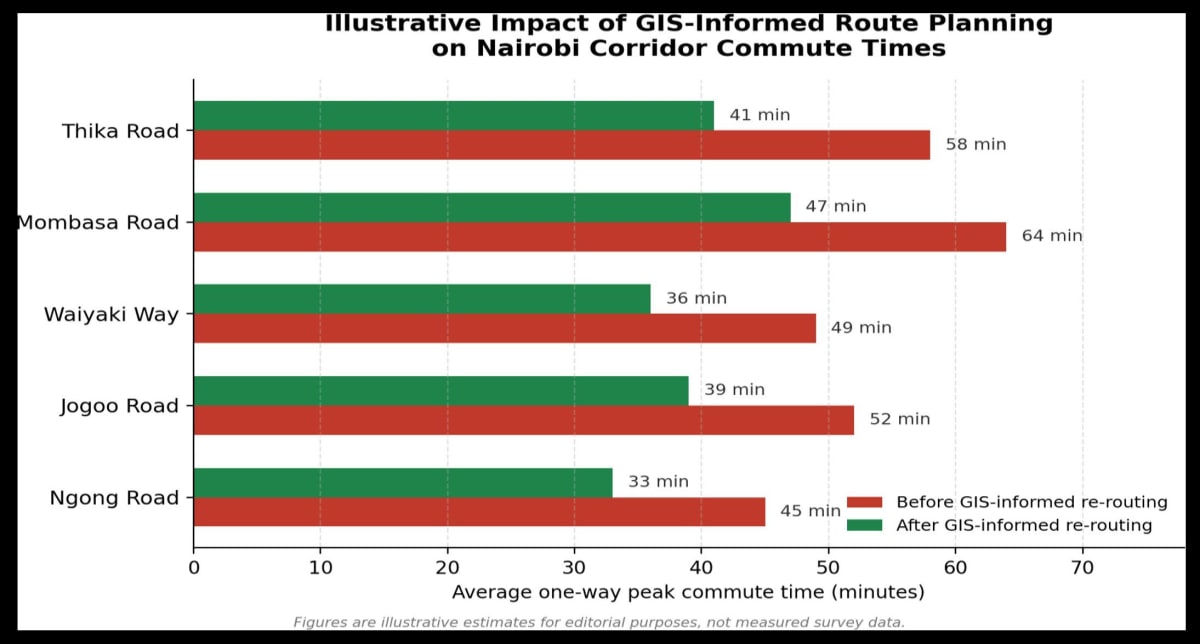
The chart illustrates the kind of improvement this approach is designed to achieve: not by adding capacity everywhere, but by targeting the specific junctions and route segments where small, data-informed changes produce outsized reductions in commute time.
What Still Gets in the Way
None of this is as simple as running an algorithm. SACCOs operate independently and don’t always share route or ridership data. Government agencies, county authorities and private operators often maintain separate records that don’t line up. And any change to a matatu route affects real livelihoods, drivers, conductors, roadside vendors, so proposed changes need buy-in, not just better maps. GIS can show the best answer on paper; getting there still takes negotiation, phased rollout and public communication.
The Bigger Picture
Nairobi doesn’t need a futuristic overhaul to move better. It needs the transport system it already has to be understood properly, one junction, one route, one dataset at a time.
That is unglamorous work, but it is exactly the kind of problem geospatial professionals are trained to solve, and exactly why firms like Serian Geospatial are increasingly being pulled into transport and infrastructure planning conversations that, a decade ago, would never have involved a map. The next time your commute is five minutes shorter than it used to be, there is a decent chance a GIS analyst had something to do with it.