
ArcGIS Dashboards, a component of ESRI’s ArcGIS Online, empower users to communicate insights by showcasing location-based analytics through intuitive and interactive visualizations on a unified screen. Organizations leveraging the ArcGIS system can utilize these dashboards to support decision-making, visualize trends, monitor real-time status, and inform their communities.
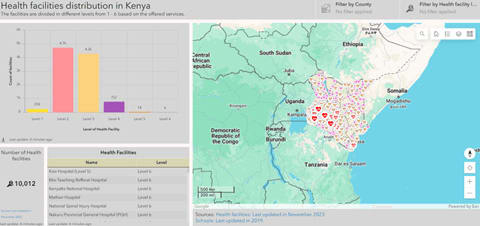
Customizable dashboards allow audiences to filter data to obtain the answers they seek. As vital information products, akin to maps and apps, dashboards are a critical component of your geospatial infrastructure (ESRI). These dashboards allow users to monitor, analyze, and interact with data through various visual elements such as maps, charts, gauges, and indicators. They are particularly valuable for real-time data monitoring, operational management, and strategic decision-making.
Key Elements of ArcGIS Dashboards
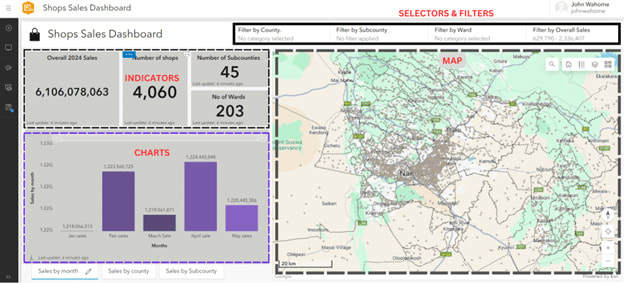
- Maps: At the heart of any GIS dashboard, maps (while not a compulsory feature) visually represent spatial data, allowing users to explore different layers of information, such as locations, boundaries, and thematic data.
- Selectors and Filters: These tools enable users to interact with the data by applying specific criteria filters. Filters can be based on location, time, or attribute values, allowing for focused analysis.
- Indicators: Indicators provide quick insights into key metrics. They can display figures like total sales, the number of incidents, KPIs achieved, or average values, offering a quick snapshot of the current status.
- Charts: Charts represent data trends and distributions visually. Common types include bar charts, line charts, pie charts, and histograms, complementing maps by providing a different perspective on the data.
- Gauges: Gauges display data within a range, often used to monitor progress towards goals or thresholds, such as showing the percentage of a target achieved.
Creating an ArcGIS Dashboard
Step 1: Data Preparation
Before creating a dashboard, ensure your data is clean, structured, and geospatially enriched. This involves eliminating inconsistencies or errors, organizing data for easy interpretation and including necessary spatial components like coordinates and boundaries
Step 2: Setting Up Your Dashboard
This step involves using the ArcGIS online to create a map using MapViewer or MapViewer Classic while symbolizing data appropriately, creating ArcGIS Dashboard as a new app and finally adding the created map in the new Dashboard.
Step 3: Adding Interactive Elements
This step involves adding interactive tools like dropdowns, filters, sliders, and date pickers as well as configuring them to interact with the map and other elements. Additionally, indicators, charts/graphs and gauges are added to display key metrics in real time, depict data trends, patterns and distribution as well as provide a quick overview of the key insights.
Step 4: Customizing the Dashboard
The dashboard can be customized as per the author’s wishes in a way that promotes intuitive user interaction by utilizing a clean layout, adjusting fonts, colors, balancing element sizes relative to other elements and map content. This stage helps to create a well balanced cohesive look.
Step 5: Publishing and Sharing
After customizing the dashboard to the author’s liking, the author publishes the dashboard through embedding it in a website or by sharing it directly with the intended audience. The author should ensure that all layers/datasets used in the map and dashboard are accessible to the audience before sharing the dashboard.
Applications of ArcGIS Dashboards
ArcGIS Dashboards offer powerful tools for visualizing and analyzing geographic data across various sectors, enhancing decision-making and operational efficiency. They can be used for various functions and sectors as shown in the following non-exclusive examples.
In public health, ArcGIS Dashboards enable real-time tracking of disease outbreaks, vaccination coverage, and health resource allocation. By integrating data from multiple sources, health officials can quickly identify hotspots, monitor trends, and deploy resources effectively, as seen during the COVID-19 pandemic.
Environmental management can benefit significantly from ArcGIS Dashboards which offer tools to monitor natural resources, track environmental changes, and manage conservation efforts. Dashboards can display data on deforestation, water quality, and wildlife populations, helping agencies respond to environmental threats and develop long-term sustainability plans.
In business, ArcGIS Dashboards support market analysis, asset management, and customer service improvements. Retailers can analyze customer demographics, sales data, and competitor locations to optimize store placements and marketing strategies. Utility companies use dashboards to monitor infrastructure, manage outages, and plan maintenance activities.
Conclusion
In summary, with rapidly expanding applications of geographical information systems and data analysis, ArcGIS Dashboards are among the most essential tools aimed at translating data into valuable information. This functionality of presenting location based analytics in a visually appealing and responsive manner makes them essential tools for organizations regardless of the sector.
Through the application of ArcGIS Dashboards, organizations can complement their decision-making process, analyse trends, receive status updates in real-time and share information with their stakeholders. Finally, it is essential to understand that the primary focus of dashboards is on the type and format of displayed information, allowing users to choose options that will meet their needs and provide valuable insights. As one of the information products, ArcGIS Dashboards fit well into maps and apps to complete a must-have capability in any GIS system.